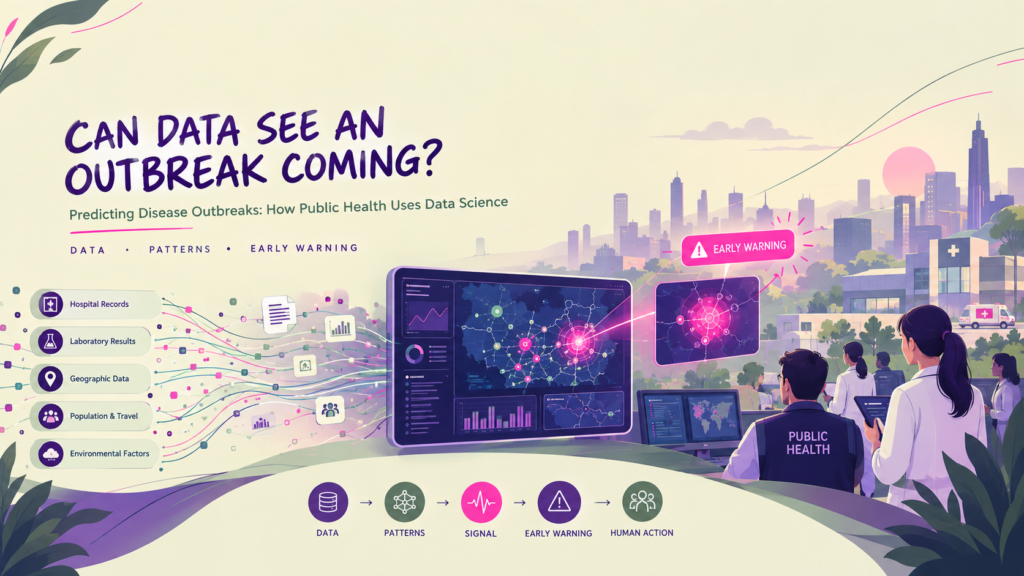
What if we could know that a disease outbreak was coming before it actually became an outbreak?
It sounds almost like something from a science-fiction movie. But in reality, scientists are already using data to look for early signs of diseases spreading.
Every day, hospitals, laboratories, governments, and researchers collect huge amounts of information. How many people are sick? Where are the cases increasing? Are more people visiting hospitals than usual? Is a particular area seeing an unusual number of infections?
On their own, these numbers might not seem very interesting. But when they are brought together, they can tell a story.
And that is where data science comes in.
Finding Patterns in Numbers
One thing I find interesting about data science is that it is not always about creating something new. Sometimes, it is about noticing something that is already there but is difficult to see.
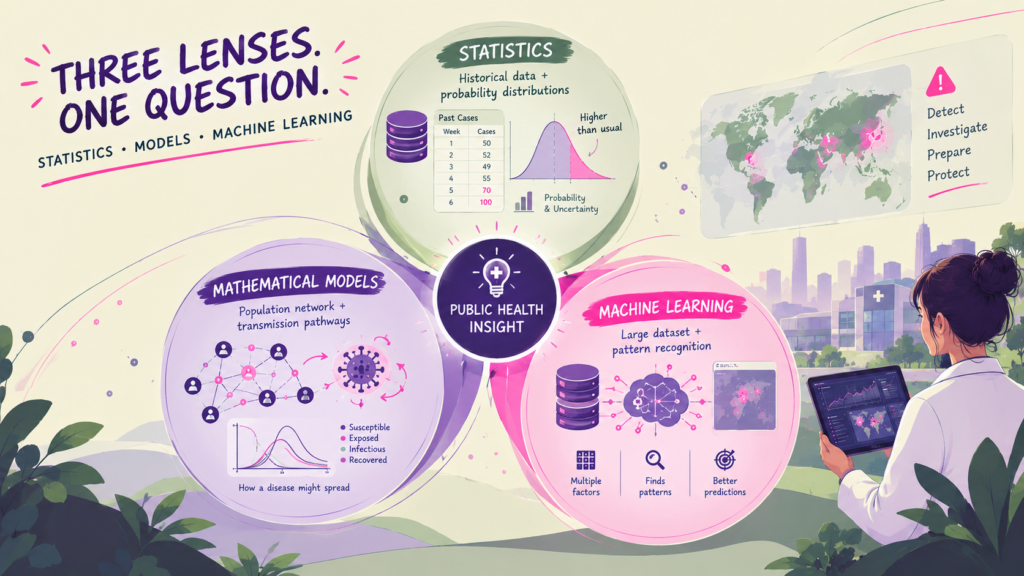
Imagine that a city normally has around 50 cases of a particular disease every week. Suddenly, there are 70 cases. The following week, there are 100. At the same time, nearby areas are also reporting an increase.
That might be nothing more than a temporary change. But it could also be an early warning sign.
Data scientists can compare this information with historical data and look for patterns. They can ask questions like:
Is this increase unusual? Where is it happening? When did it start? Is it spreading to nearby areas?
These questions may seem simple, but answering them using thousands or millions of records is where data science becomes extremely useful.
How Does Data Science Actually Help?
There isn’t one single method that can predict a disease outbreak. Instead, several areas of data science can work together.
Statistics can help researchers understand whether an increase in cases is unusual or could simply be normal variation.
Mathematical models can be used to explore how a disease might spread through a population.
Machine learning can help computers find relationships and patterns in large datasets that might be difficult for a person to identify manually.
For example, a model could look at previous cases, population density, vaccination rates, travel patterns, weather conditions, and other factors.
It might then identify situations that deserve further investigation.
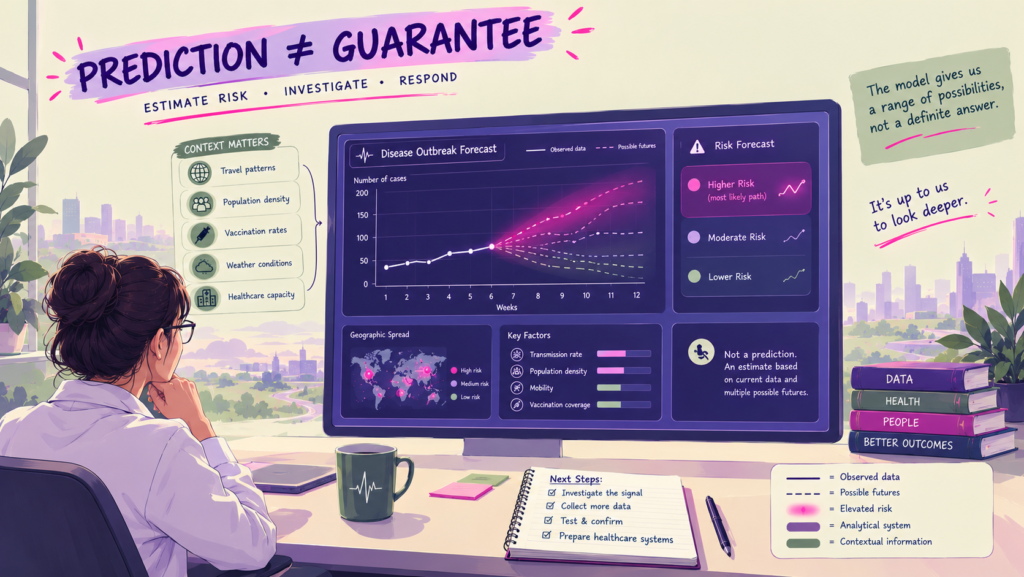
But there is something important to remember: a prediction is not a guarantee.
A computer can estimate risk, but it cannot know exactly what will happen. There are simply too many factors involved in how diseases spread.
Why Early Detection Matters
When it comes to infectious diseases, timing is incredibly important.
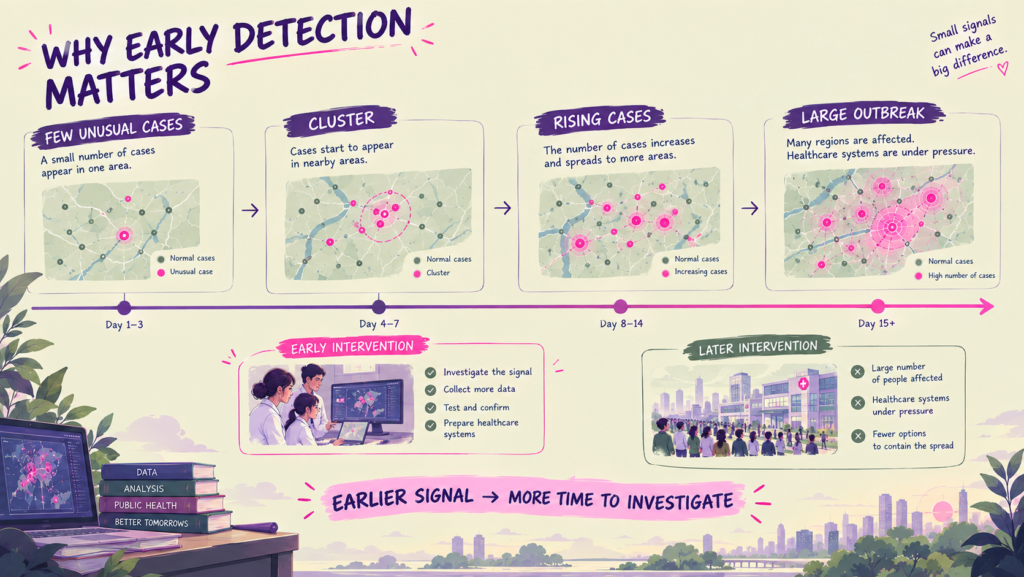
Finding an outbreak after thousands of people have already been affected is very different from noticing unusual activity when there are only a few cases.
This is why early-warning systems are so valuable.
Suppose a computer system notices that several nearby regions are suddenly experiencing higher-than-usual numbers of similar cases. That doesn’t automatically mean there is an outbreak.
Instead, it gives researchers a reason to look more closely.
They might collect more data, conduct additional tests, investigate possible sources of transmission, or increase monitoring in those areas.
So, in my view, one of the most interesting things about data science is that the computer doesn’t necessarily make the final decision. It helps humans know where to look.
What Can a Map Tell Us?
Another part of this topic that I find fascinating is the use of maps.
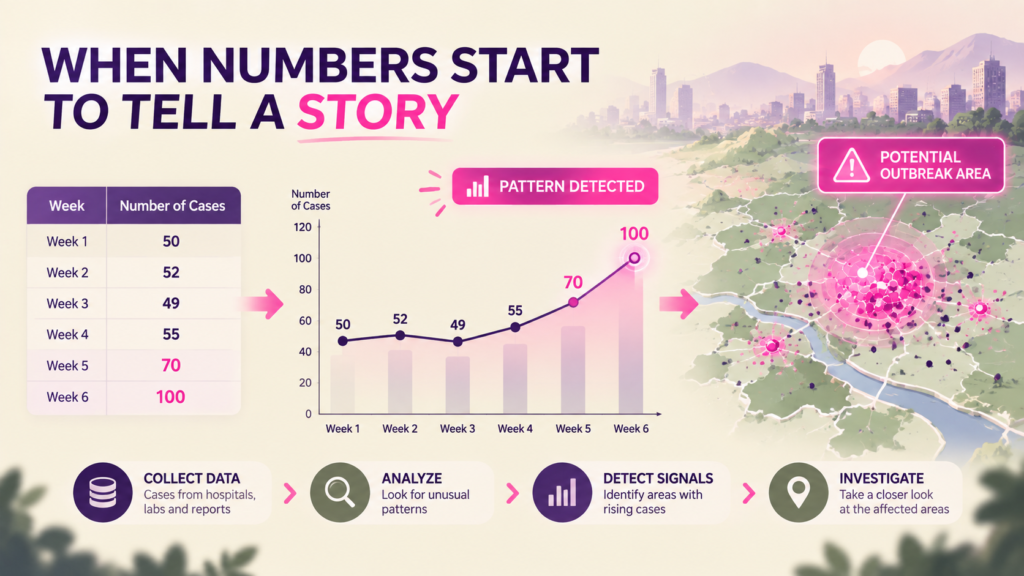
Imagine looking at thousands of disease records in a spreadsheet. It would probably be difficult to notice much just by looking at rows and columns.
Now imagine putting those cases on a map.
You might suddenly notice that many cases are concentrated in one area. Or perhaps they appear to be spreading from one location to another.
This is where data visualization and Geographic Information Systems, or GIS, can be useful.
A good visualization can turn a huge amount of complicated information into something that is much easier to understand.
And it isn’t just about making a graph or map look good. A good visualization can actually help researchers notice something they might have missed.
But What If the Data Is Wrong?
This is probably one of the most important things I learned while exploring this topic.
We often assume that if we have a lot of data, we automatically have good data.
But that’s not necessarily true.
Suppose one region reports fewer cases than another. Does that mean fewer people are actually sick there?
Not necessarily.
Maybe people in that area have less access to healthcare. Maybe there aren’t enough testing facilities. Maybe cases aren’t being reported properly.
If those missing or inaccurate numbers are given to a machine-learning model, the model may produce a prediction that looks convincing but doesn’t reflect reality.
This made me realize that data science isn’t just about algorithms. It’s also about understanding the data itself.
Knowing where the data came from, what might be missing, and whether it represents different groups fairly is just as important as building the model.
Every Data Point Represents a Person
There is also a human side to all of this.
When we talk about datasets, it can be easy to forget that behind every number is potentially a real person.
A health record could represent someone who was sick, someone who went to a hospital, or someone who received a particular test.
That makes privacy extremely important.
Researchers need to think carefully about how health information is collected, stored, and used. They also need to make sure that models don’t unfairly disadvantage certain groups because those groups were poorly represented in the original data.
So the question isn’t just:
“Can we build a model that predicts disease outbreaks?”
We should also ask:
“Can we build one that is accurate, responsible, and respectful of people’s privacy?”
Data Science Is More Than Coding
As someone who is interested in pursuing data science, this is probably the part I find most interesting.
When I first thought about data science, I mainly associated it with computers, programming, and numbers.
But the more I explore it, the more I realize that it brings together many different areas.
There is mathematics and statistics for understanding the numbers.
There is computer science for working with large amounts of information.
There is machine learning for identifying patterns.
There is data visualization for communicating those patterns to people.
And there is the actual subject being studied—in this case, public health—which helps us understand what the results actually mean.
That combination is what makes data science so interesting to me.
Can We Really Predict the Next Outbreak?
The honest answer is: not perfectly.
Disease outbreaks are complicated. People’s behavior changes. People travel. Weather changes. Healthcare systems differ. Viruses and other pathogens can also change.
Because of all these variables, predicting an outbreak isn’t like solving a straightforward maths problem where there is one definite answer.
Instead, data science can help us estimate risks and identify unusual patterns.
A model might say, “This situation looks unusual and deserves attention.”
It cannot necessarily say, “An outbreak will definitely happen next Tuesday.”
And I think understanding that difference is really important.
Data science isn’t about having a crystal ball.
It is about making better use of the information we already have.
Why This Topic Interests Me
The more I think about this topic, the more I like the idea that something as ordinary as a spreadsheet can contain information that could potentially help protect people.
A sudden increase in cases could be a clue.
A cluster on a map could be a clue.
A statistical change that doesn’t look important at first could be a clue.
Data science gives us tools to find these clues and investigate them.
What I find especially exciting is that this isn’t just about technology. It is about using technology to solve a problem that affects real people.
As a Grade 11 student exploring data science, I am still learning what the field involves. But topics like this have made me realize that data science can go far beyond coding or sitting in front of a computer.
It can involve asking questions, understanding human behavior, working with statistics, solving problems, and making sense of information that initially seems overwhelming.
Looking Ahead
I don’t think technology will ever make disease outbreaks completely predictable. There will always be uncertainty, unexpected factors, and limitations in the data.
But perhaps the goal doesn’t need to be perfect prediction.
Maybe the goal is simply to notice the warning signs a little earlier.
If data can help researchers identify an unusual pattern, investigate it sooner, and prepare healthcare systems before a situation becomes more serious, then that data can have a real-world impact.
And that is what makes this field so exciting to me.
Data is more than numbers sitting in a spreadsheet.
Sometimes, it can tell us a story.
Sometimes, it can raise a question.
And sometimes, it can give us a warning.
The challenge for data scientists is learning how to recognize that warning—and, perhaps even more importantly, learning how to use it responsibly